

» A new advancement of CONIAS SUSAFE
Status quo using Turkey as an example
- 81 provinces
- 17 ongoing conflicts
- 1,377 data sets
- Snapshot of one month
Added value of our new product
- Current risk and risk development with CONIAS SUSAFE
- Trend development with CONIAS SUSAFE Calculated Trends
- Gaining insights into details and conflicts per region with CONIAS SUSAFE Conflict Insights


In the following, the wide range of use cases offered by our latest MBI CONIAS product Self-Explaining Political Risk Data are shown using the example of Turkey. With MBI CONIAS Risk Intelligence, you have the opportunity to obtain these insights and trend forecasts for a large number of countries worldwide in order to assess political risks and their impact.
CONIAS SUSAFE – our basic product
Analyzing the current situation in order to understand the extent of politically motivated physical violence


This product only contains our CONIAS SUSAFE basic product. It is recommended for a general overview of political risk.
» Current highest intensity per subnational unit
As of July 2021, Turkey was affected by a total of 17 different conflicts. The map shows the highest measured intensity per subnational unit.
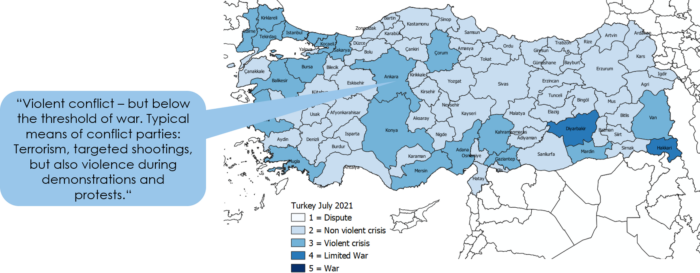

With our CONIAS Risk Intelligence database, we offer the service of a "translation of values into text" - to give the inexperienced analyst quick access to the data. In addition, we also provide a kind of interpretation for assessing the consequences of political risks.
» Number of ongoing violent conflicts per province
The map shows, in addition to the highest observable intensities of a region, the total number of violent conflicts that took place in that province in July 2021.
While some regions experience violence from only one conflict, other regions are the site of as many as five different conflicts.

Setting the current situation in a temporal context for adequate risk management
Of relevance to risk managers and analysts is not only an assessment of the current conflict situation and its impact on physical security in the different regions, but also how representative this month is for the country.
» Highest intensity and number of months with violent conflicts per region
You are currently seeing a placeholder content of Standard. To access the actual content, click on the button below. Please note that data will be passed on to third-party providers.
More informationHighest intensity of 12 months
The map shows that significantly more provinces were affected by high political violence in the past year than the month under study.
Number of months of violence
The map also shows the number of months in which political violence was observed out of the eleven investigated. On the one hand, this provides information about the level of conflict, but also about the regularity with which political violence can be observed.

» Current intensity and median of the last 12 months

Median of regional intensities
To put current conflict events in historical context, the median of all measured intensities in the region is used. In contrast to the average, the median is less susceptible to "outliers".
CONIAS SUSAFE Calculated Trends - Add-On for the basic product
Predicting the future completely correctly and thus accurately naming all risks will probably remain a dream. But just by observing the behavior of conflicts in each affected region, the risk of political violence can be correctly predicted for more than 80% of all nearly 4,000 regions studied. We are working on further models to continuously optimize this figure.

» Calculated trend for the next three months
Based on the current monthly values (07-2021), we expect the following development with respect to the maximum measurable intensity per region:


This product contains our CONIAS SUSAFE basic product and, in addition, CONIAS SUSAFE Calculated Trends as an add-on. It is recommended for a general overview and long-term risk management using trend forecasts.
» Current month and the calculated trend as verbal advice

Calculated trend values are an extremely useful tool for determining the magnitudes of political risks. But - similar to weather forecasting - the prediction accuracy decreases the further the period of interest is in the future. This is where our product CONIAS SURE might be of interest.
But a look at the details can also provide further understanding of a region's conflict situation and show which news items to pay particular attention to in the future.
CONIAS SUSAFE Conflict Insights - our comprehensive product
» Overview of all conflicts which affect the political risk of the province


This product contains our CONIAS SUSAFE basic product, the add-on CONIAS SUSAFE Calculated Trends as well as CONIAS SUSAFE Conflict Insights and thus includes our entire range of services. It is recommended for detailed analyses of conflict situations, political risk, and trend forecasts as part of short- and long-term risk management.
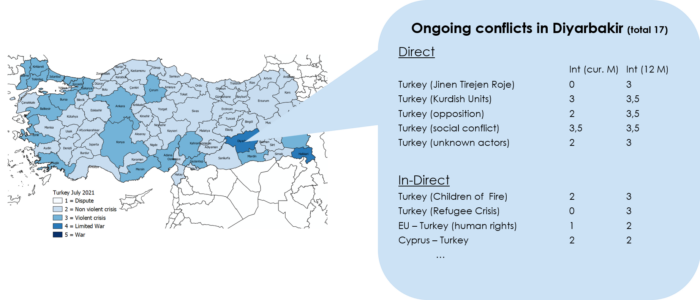
» Ongoing conflicts in the region Diyarbakir
Our CONIAS SUSAFE Conflict Insights provide deeper insights into the ongoing conflicts in a region as well as their backgrounds. The example below shows an incomplete section of the ongoing conflicts in the Diyarbakir region.

» Analyzing the conflict activity – possible for each ongoing conflict

Information on ongoing conflicts in a region is essential for empirically based risk management. The evaluation possibilities as well as the gain in knowledge are enormous – but also require deeper knowledge about political conflicts and their behavior.
In addition to further explanatory data, which clients can book, we also recommend attending our MBI CONIAS Academy.
Releases/Updates
Monthly or quarterly release of up to twelve updates (on the 15th of the following month) can take place in one year
- in the formats csv and json,
- in the geoformats Shapefile, Geojson and Mapinfo.tab.