

Structural Conflict Risks
As analyses show, states are disproportionally affected by severe political violence. This indicator informs about the structural disposition and inclination of particular countries and their respective regions towards political violence. The Structural Conflict Risk value comprises systematically assessed historic conflict sequences and is augmented with meaningful socioeconomic data.
The following table will serve as an example. It shows the Structural and Current Conflict Risk as well as the Conflict Risk Trend for the subnational units of Ukraine. In May 2017, only the Donbas regions Donetsk and Luhansk as well as the capital Kiev experienced violence. The other regions all share the same low Current Conflict Risk value. Only taking these into account, there seems to be little reason to abstain from long-term business commitments. However, the Structural Conflict Risk values paint a different picture and reveal considerable differences between the regions, highlighting for example the structural vulnerability to conflicts of Kharkiv and Odessa.

Current Conflict Risks
The assessment of the monthly conflict risk in a geographical unit is based on the specific intensities of the conflicts prevailing in a region at a given point in time. The intensities are continually captured and calculated in accordance with the CONIAS methodology.
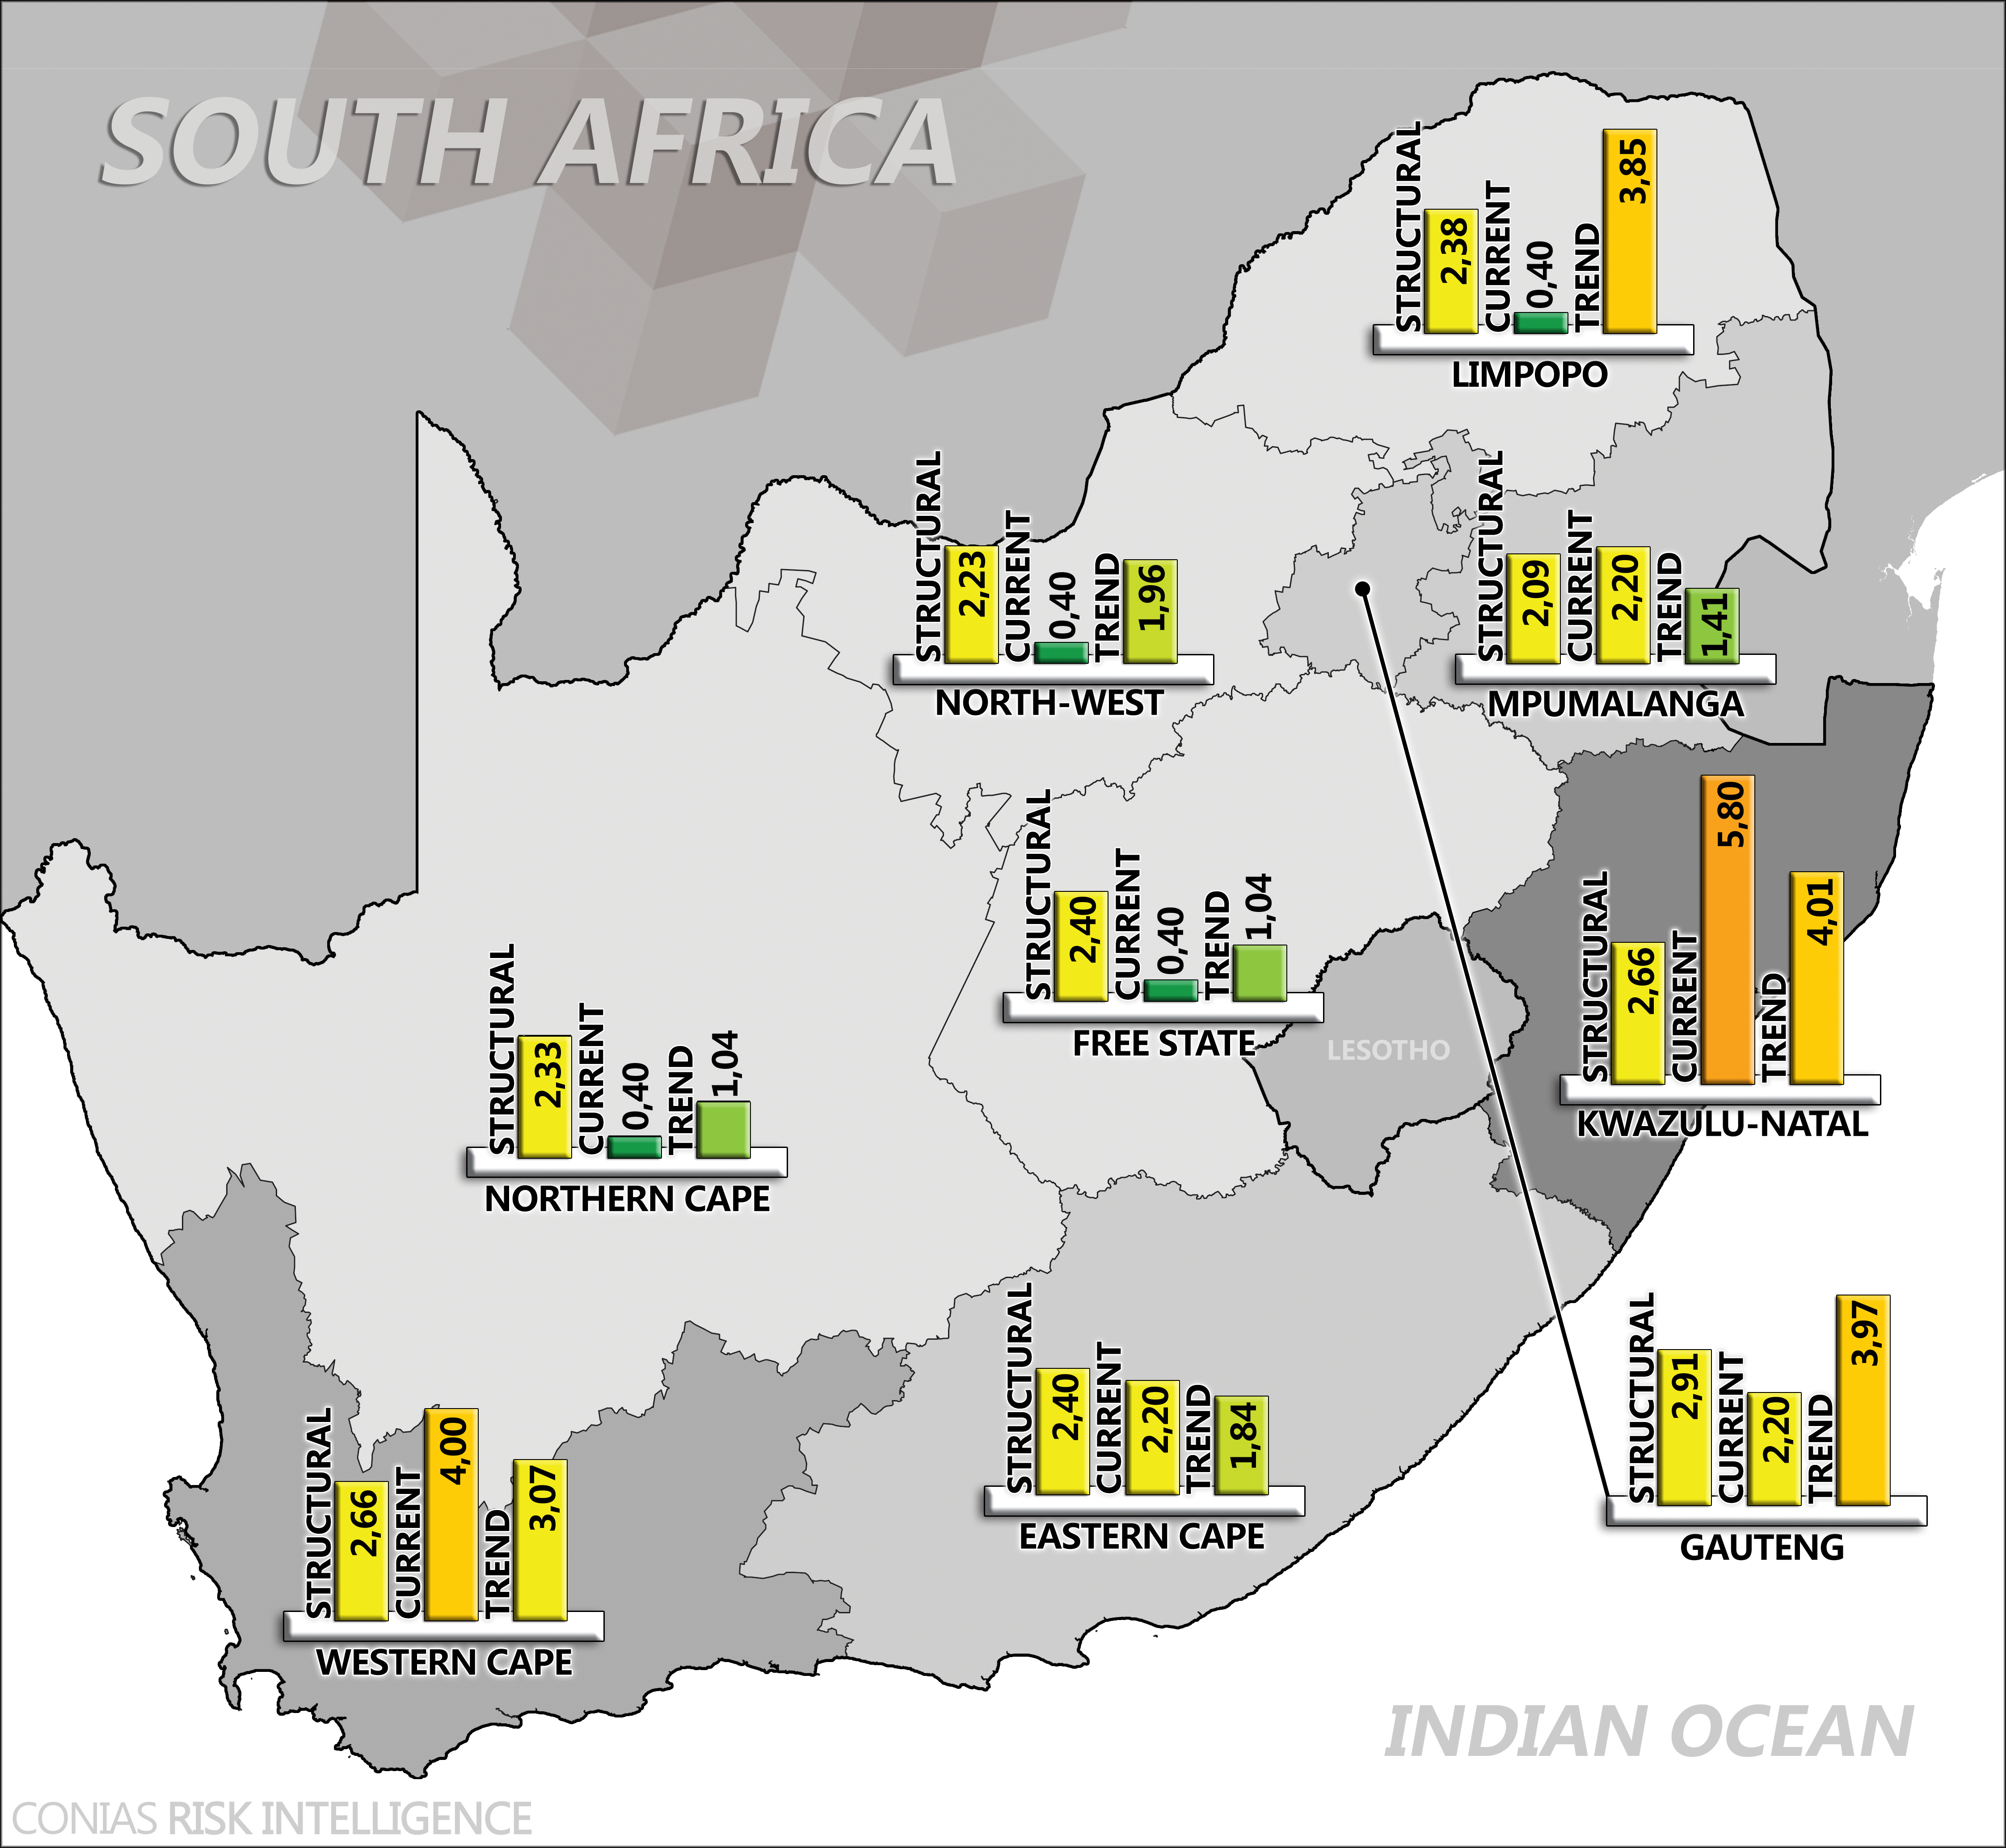
As an example, the following map displays the risk indicators for each region of South Africa. Only taking into account the Structural Conflict Risk value, a clear distinction between the regions is hard to make, meaning almost no differences in long-term proneness to conflicts. The Current Conflict Risk values for May 2017, on the other hand, clearly show that for example the provinces Kwazulu-Natal and Western Cape are way more affected by ongoing political conflicts, e.g. President Zuma‘s struggle to stay in power or the often violent student protests. These examples show the relevance and the benefits of the Current Conflict Risk indicator.
Conflict Risk Trends
The Conflict Risk Trend outlines the anticipated risk of a subnational unit and is monthly updated. The scope of the trend covers the upcoming months. The Trend takes several factors into account, e.g. past conflict intensity fluctuations, the respective conflict items and their affinity to conflict escalation and combines this data with information about upcoming, significant political events like elections.
The following data illustrates the usefulness and the accuracy of the Conflict Risk Trend. The table displays the three conflict risk indicators for all regions of India based on May 2017 data. Additionally, it features the actual Current Risk values for June 2017 in order to allow for an evaluation of the Conflict Risk Trend.
Especially the states Arunachal Pradesh, Haryana, Jharkand, and Odisha deserve closer consideration. The Current Risk values (May 2017) of these regions present no or only small scale violent conflicts. Yet, at the same time, the Risk Trend indicates an escalation of violence in the months to come. Examining the Current Risk values for June 2017 for these regions proves the importance of the Conflict Trend in addition to the Structural and Current Conflict Risk indicator: in June, the level of violence increased significantly in all of these four regions compared to the May level, just as projected by the Trend value.

Worldwide Comparability and Methodological Consistency
One of the key features of the CONIAS approach is strict consistency in its application across time, subnational units, and conflicts. Our risk scores are based on a coherent, scientifically approved form of intelligence gathering, value assignation, and scaling. It is this consistency that allows our clients to make meaningful comparisons between production sites, supplier locations, or regions and countries regarding their political risk exposure. Therefore, a combination of our three risk indicators, all based upon the CONIAS approach, provides for reliable short- and long-term predictions on how the security and political situation in a certain region will most likely develop as well as a monthly overview of the current conflict situation in a region.

The graph shows all three of our risk indicators for a selected group of 14 regions worldwide. This includes the Current Risk value for the month of May 2017 as well as a corresponding six month forecast. For further comparison, the actual Current Risk values for June 2017 have been added. In May, a highly violent security situation was predicted for Cairo (Egypt), Michoacan (Mexico), and especially Manila (Philippines), indicated by a heightened Risk Trend value. Likewise, although the Current Risk values for May do not indicate prevailing violent conflicts in Addis Ababa (Ethiopia), London (Great Britain), and Beirut (Lebanon), the Risk Trend warns of a violent conflict escalation in these regions. Comparing our forecast with the Current Risk values for June for all the regions mentioned clearly elucidates the benefits and the reliability of the Conflict Risk Trend.